









Wastewater service charges vary considerably across EPA regions and States. That’s one of the key findings from the National Association of Clean Water Agencies’ (NACWA) Cost of Clean Water Index. If you live in Montana, Wyoming or the Dakotas (EPA Region 8), your average service charge of $261 a year is considerably less than the $884 your fellow Americans up in New England (EPA Region 1) are paying. As you can imagine, much of the difference is to do with population size and geography.
The Index which summarized the responses of 174 utilities found that the national average charge for wastewater collection and treatment services rose 3.6% in 2017 to hit $501 per year. Interestingly for an industry much maligned over the years by a lack of investment to replace aging infrastructure, the increase was 1.5% higher than inflation (as measured by the Consumer Price Index). The expectation is that service charges will continue to rise between 3-5% over the next 5 years as utilities continue to catch up to infrastructure projects that were put on hold during the 2007-2009 recession.
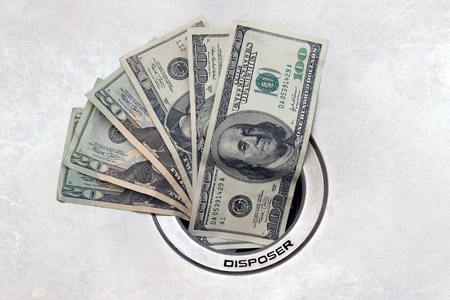
Since the year 2000, the average annual service charge has increased more than 125% from $222 to $501. Are we finally seeing a financial maturity in the wastewater industry where operational budgets are being set to balance operational needs? Or has the state of wastewater infrastructure deteriorated to the point where utilities are being forced to act and require customers to pay for it regardless of the political ramifications with their electorates?
The utilities say drivers for rate increases include consent decree requirements, population growth-related construction projects, combined sewer overflow (CSO) long-term control plan compliance, debt reduction and nutrients/total maximum daily loads (TMDLs) regulatory mandates.
When looking out over the next five years, more than 40% of utilities have planned rate increases averaging 3.86% with less than 10% of utilities expecting no change in their rates. Although the % increases outpace inflation each year, it’s important to bear in mind that the annual rate increase in dollars will average $25/year or roughly $2.00 extra on the monthly utility bill.
When put into that perspective and knowing how much of our sewer systems need to be repaired or replaced, it seems a sensible increase to ask customers to bear.